Sunday, April 29, 2007

Architect's Role - Concept Map


I am doing some work for a large architectural firm -- very interesting and I am learning a lot about the industry. Here is a concept map I created to remind myself of the differences between architectural concept drawings and contractor's shop drawings.

Monday, January 29, 2007


Here are three maps I created for Bootstrap Austin representing the Ideation Phase, Valley of Death Phase, and Growth Phase all bootstrapped businesses go through.

Monday, January 22, 2007

Visual Learning on Steriods

Wired Magazine has a wonderful new video demonstrating a multi-touch display in use by its creator Jeff Han. This video has been wildly popular in the blogosphere and has been downloaded many times from YouTube. On the surface, the Wired article is about a revolutionary new user interface scheme, but I couldn't help but notice how little of the information is pure text and now much is graphical in nature. Not only with the tools we use change the nature of work, but the format and construct of our knowledge sharing will change also. Highly recommend you look at Han's demonstration.

[link: fastcompany.com|via asourceofinspiration.com]

Wednesday, January 17, 2007

Information Design Examples


I have had several discussions lately with colleagues about the importance of information design. As a point of illustration I have remarked I had several calendars on my desk. They all contained the same information, but depending on how I will be using the information, I will likely pick one calendar over the other. For example, if I just want to know what the date is of the third Thursday in July, I will probably pick up the little 12-sided calendar.


Or, if I want to make a note of my next dentist appointment I might jot it down on one of these two calendars, depending on whether I want the information at my desk or in my purse:

This little calendar, on David Seah's website as part of his Printable CEO tools, is great for project planning by week:


And just for fun (because I'm not exactly sure how one would use these circular calendars), here are a couple more:

They must be useful to someone!

So what does this have to do with graphic recording or graphic facilitation?

In addition to thinking about what information to record and how to capture it visually, the artist must also consider how the information is likely to be used by viewers. For example, the placement position on the page, the arrangement of images in relationship to other images and words, and the sizes selected for images and words are all important considerations. Certainly for pre-planned recording, the artist must give some thought to the process, although this is a much more challenging proposition for those recordings drawn on the fly.

links: Creative Calendar Design

Monday, August 07, 2006

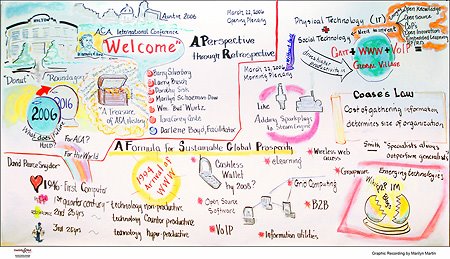
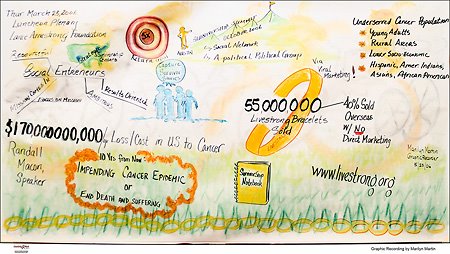
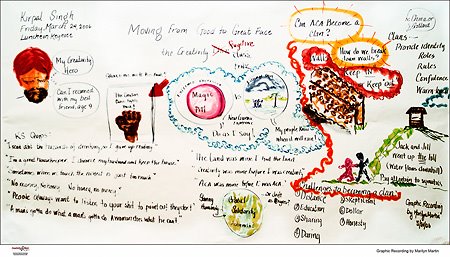
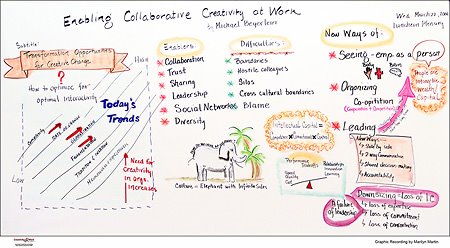
Graphic Recordings from ACA 2006 Conference


Here are selected recordings from the 2006 American Creativity Conference International Conference.

Graphic recording is done completely "on the fly." When I step before the paper, I have no idea what the speaker will be saying and have no opportunity to pre-plan. I am always a little fearful that I will either run out of paper or have a big blank space when the speaker is done, but somehow quite magically, when the microphone is turned off, I have a full sheet (usually 4' x 8'). As you might expect, occasionally there are misspelled words and the artwork is less refined than some of my other work. I particularly enjoy watching the audience reaction to my renderings and hearing the conversations that occur in small groups that gather to inspect what I have drawn.

The photos are courtesy Frank Ragan Photography. Check out Frank's amazing photography at his website.

Saturday, August 05, 2006

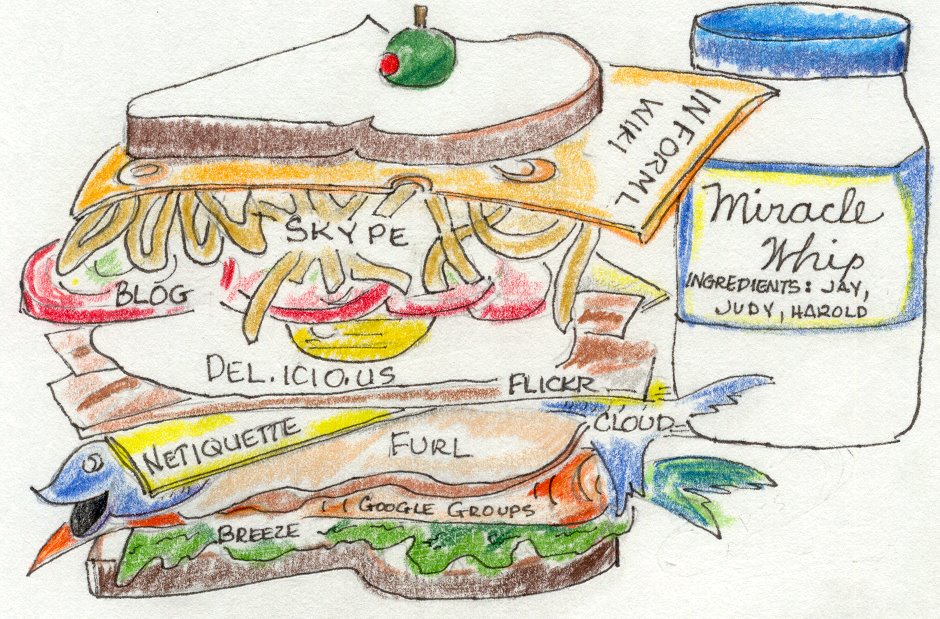
Big Bite


Here is a piece I did that provides a little commentary on all of the rich content I was exposed to while participating in Jay Cross' UnWorkshop 2.

One of my assignments was to create my own blog and this image was first published there.

Size 6" x 6"

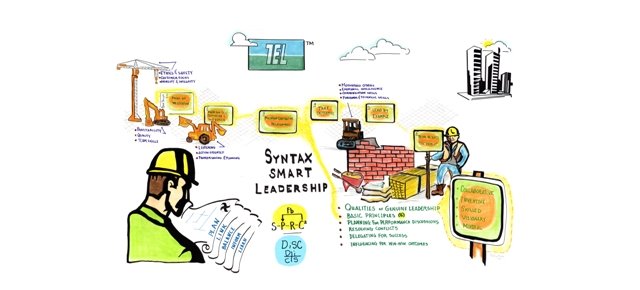
Tokyo Electron - Pictograph Tieing Together Several Leadership Programs


This is a pictograph I did for Tokyo Electron - US to orient learners to the content in their various leadership development programs and how the various components relate to one another.

Sometimes I create images that are digitally drawn, e.g., the finish rendering has very high production values. TE wanted something that had a hand-drawn, organic feel.

Size: 4' x 6'

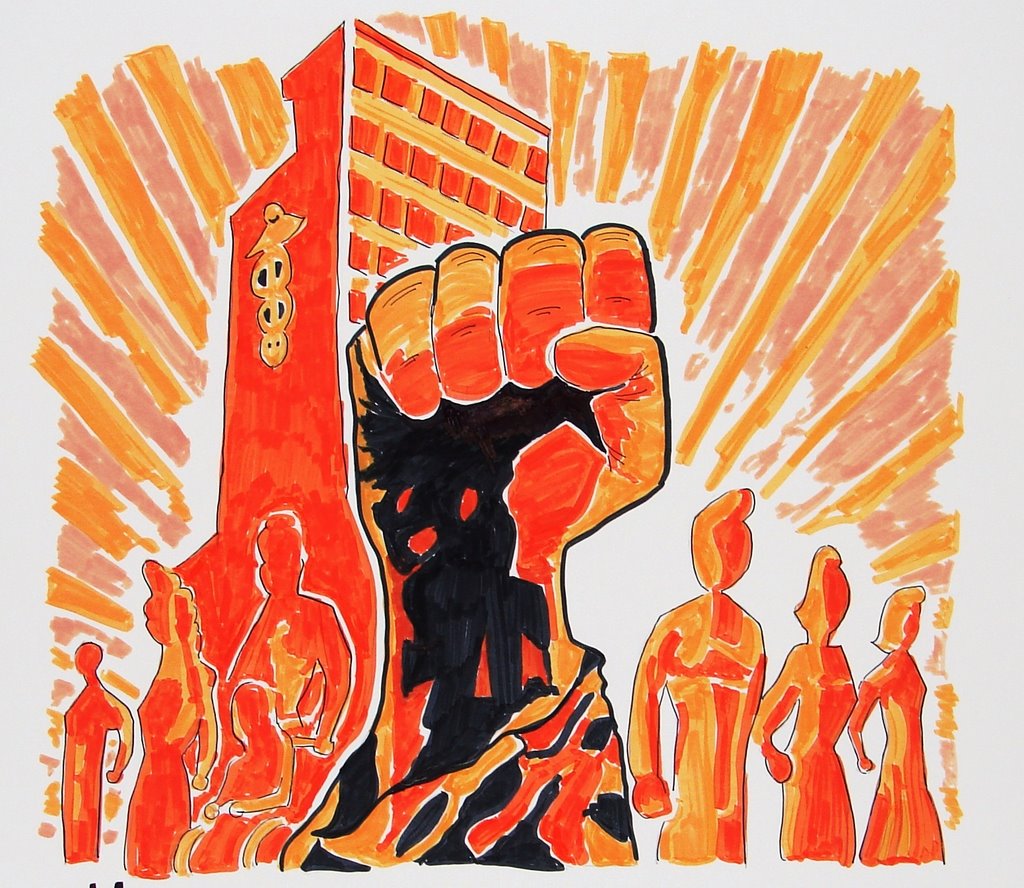
ABL - Medsphere


This is an image from a promotional film Medsphere produced to market their product -- electronic healthcare records. I recreated it in a pictograph for Adaptive Business Leaders who recognized Medsphere for innovation in 2006.

Size of entire pictograph 3' x 4'
Size of this image 2' x 2'

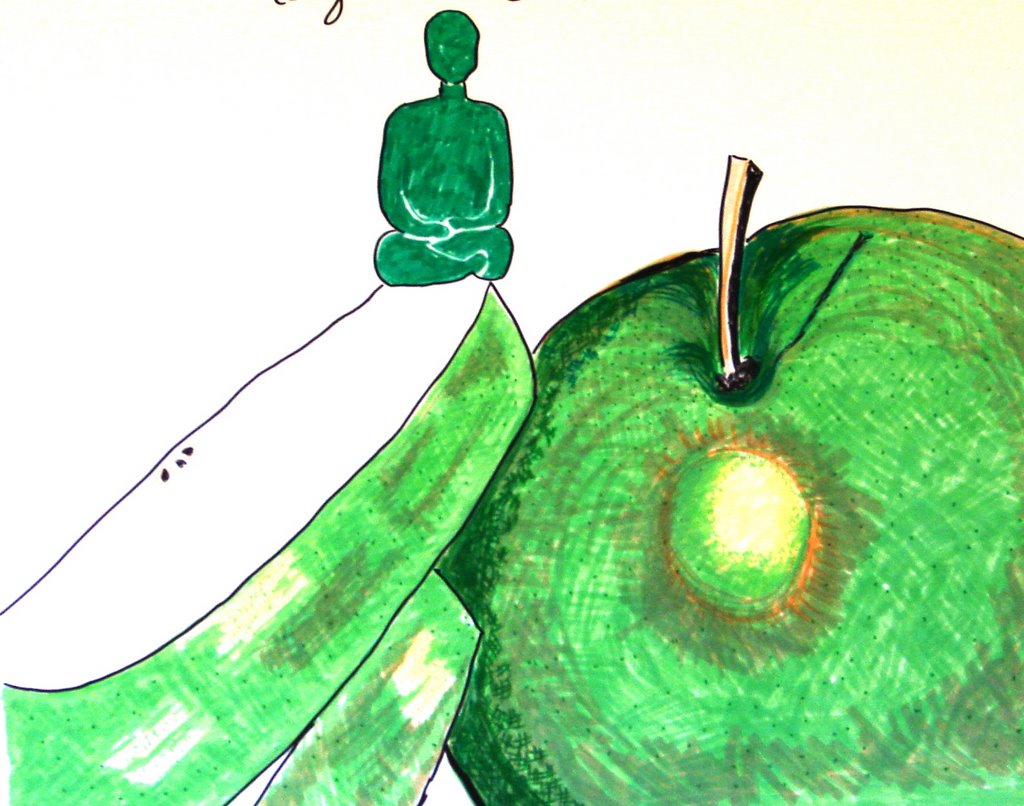
ABL - Promoting Health online


Adaptive Business Leaders in Orange, CA., annually recognizes innovations in the Healthcare Industry. Here are a pictogaph I did for them to illustrate the offerings of one of their 2006 finalists. The apple and green form mediating represents a company that promoted a healthy lifestyle using online behavior modification tools.

Size of entire pictograph 3' x 4'
Size of this portion of the pictograph 2' x 2'

ABL - Mobile Reminder System of BeWell Mobile

This is a portion of an image I created for Adaptive Business Leaders of southern California to represent the services offered by one of the 2006 Innovation Finalists in ABL's annual competition. The company, BeWell Mobile, sends text messages to chronically ill subscribers, reminding them to follow a prescribed healthcare regimen.

Size of entire pictograph 3' x 4'
Size of image shown 2' x 2'

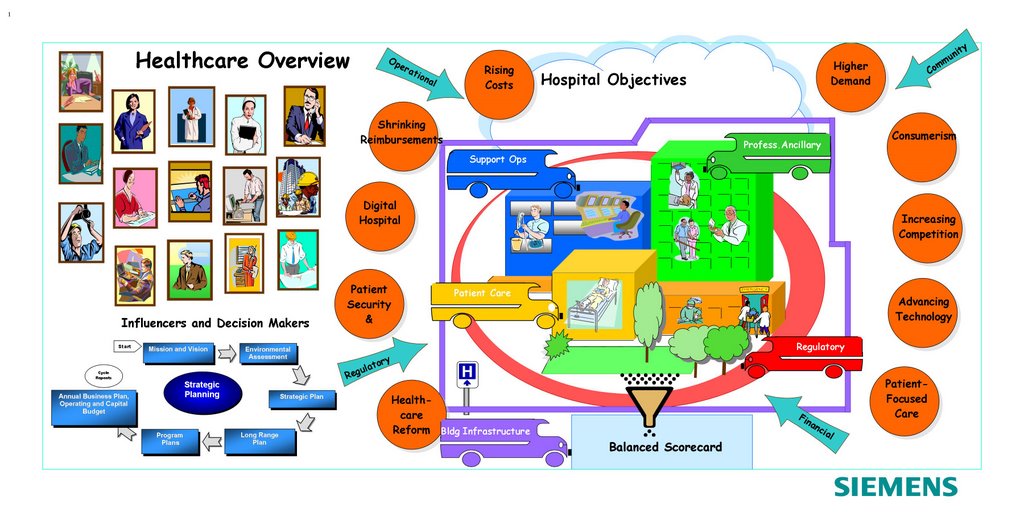
Siemens Building Technologies - Healthcare Course


This is a pictograph that captures all of the concepts taught in a sales course relating to the healthcare industry.

The course was 2-1/2 days long and additional pictographs were made of the various components on this one.

Size 4' x 8'

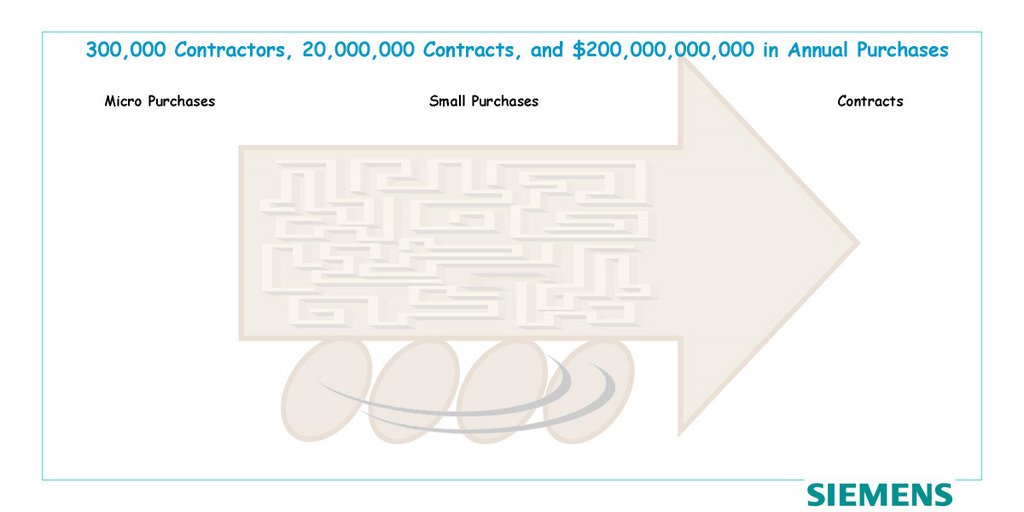
Siemens Building Technologies - Another course


This pictograph was created to support a learning activity for a course on goverment sales. It required learners to make distinctions among the various types of government purchases.

The entire course is 3 days in length; this is one of the highly interactive, collaborative activities. The course was highly rated by attendees.

Size: 4' x 8'

Dr. Edward DeBono at ACA Conference


I am pictured here with Dr. Edward DeBono, the reknown creativity expert, before a graphic recording I made of his presentation at the 2005 International American Creativity Conference.

Dr. DeBono is autographing the pictograph (size 4' X 8').

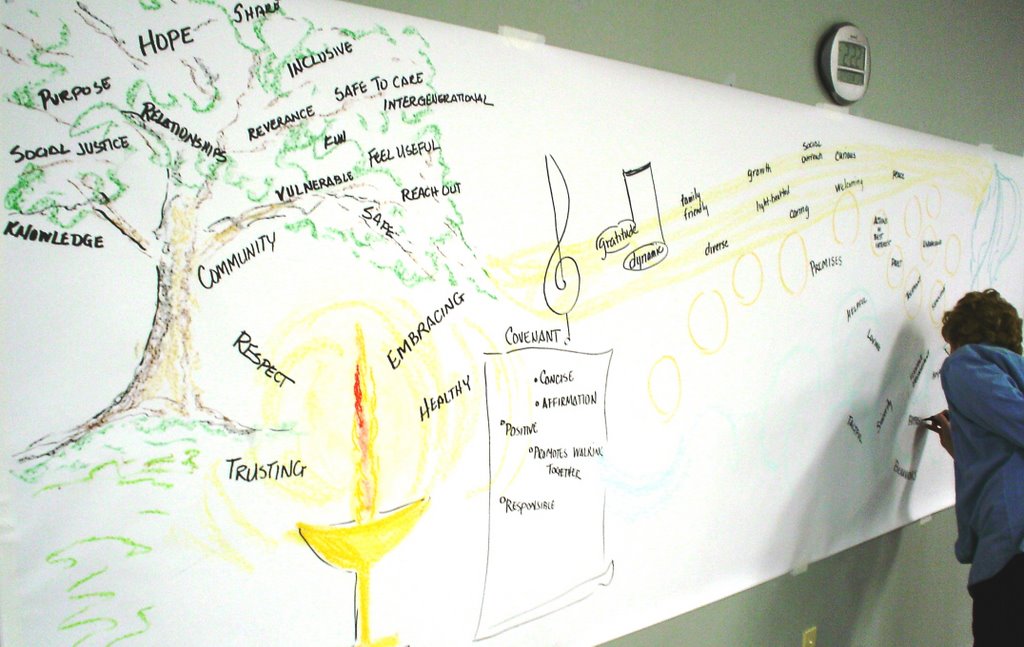
Graphic Recording at Unity Church - 2006


In this snapshot, I am capturing the outputs of a Visioning Activity by the congregates of Unity Church, Austin, as the activity unfolds. This is a classic example of Graphic Recording.

Tuesday, August 01, 2006

Conference Poster for American Creativity Association


The ACA asked me to create a poster for their 2005 conference using Concept Mapping techniques. This is the output. It was used to advertise the conference, on the conference program, and later as the back cover of the first book published by ACA Press.

Caty's and Jack's Table and Chairs - Just for Fun

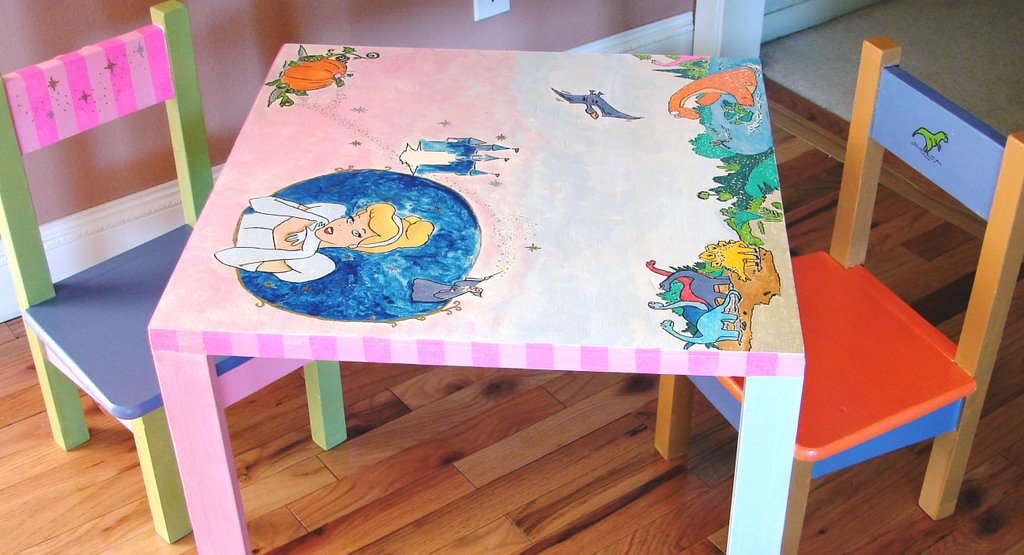
This is the play set that Gramps and I made for beautiful Caty and handsome Jack. Gramps did the carpentry work and I did painted. Cinderella is very important to Caty, as are dinosaurs to Jack. And they do use the table for learning -- colors, shapes, sharing, building language skills, etc. So I suppose this is a form of visual learning as well!


With love, from Abuelita and Gramps